Thanks to Creative Cardiff for inviting me to speak at this timely conference, when there is renewed interest across the country in the potential of industrial strategy and how the creative economy should feature in it.
In the time I have available I will explain the powerful role that rigorous classification and measurement can play in industrial development through legitimising new and emerging parts of the economy. I want to illustrate what measurement of the creative economy has enabled in terms of allowing us to more accurately characterise the nature of the creative economy, and to alert policymakers to its economic significance. In short, its role in putting creativity on the map.
But I also want to illustrate how the recent expansion in data sets available to analysts and a widening of analytical toolkits has permitted a richer understanding of the creative economy. I'll end by suggesting that it is now time to push forward the measurement agenda in the creative economy area – beyond legitimation, and towards a more active role for data in creative economy development.
Line chart titled "Figure 1: Incredible statistics" with two y-axes (GVA (£Million) on left, % UK GVA on right) and x-axis (years 1997-2009).
The chart shows two lines:
* GVA (green line): Represents Gross Value Added, starts around £30,000 million in 1997, rises to over £50,000 million by 2007, then sharply declines to under £30,000 million by 2009. A text box above this line states: "Creative industries growing > UK economy".
* % UK economy (red line): Represents creative industries as a percentage of UK GVA, starting around 3.5% in 1997, peaking around 5.5% in 2007, then sharply declining to below 3% by 2009.
Two text boxes provide context:
* Above the sharp decline: "Industrial collapse? No. Change in classification in 2011: exclusion of software from creative industries".
* Below the chart: "Prior to 2011, classification and measurement of UK creative industries had been done in an opaque and non-systematic way."
Source: DCMS (2010, 2011)
But let me begin by showing you some incredible statistics. Figure 1 is what an analyst of the UK's creative industries may have plotted in December 2011. It shows the Gross Value Added of the UK's creative industries on the primary axis (the green line) and expressed as a percentage of whole economy GVA on the secondary axis (the red line). The chart shows that the creative industries were growing up until 2007-2008, at which point they appear to have undergone a cataclysmic reduction in output.
In actual fact, there had been no such industrial collapse: rather, the Department for Culture, Media and Sport (DCMS) had, in December 2011, reclassified the list of industrial sectors deemed 'creative' for measurement purposes (and, in particular, excluded two ICT-related Standard Industrial Classification (SIC) Codes which had previously been included) and re-computed the series for 2008 onwards on this basis. The episode caused huge controversy and confusion in industry: they revealed that the basis on which the government labelled some industries 'creative' and others not was unclear, and notwithstanding the obvious point that breaks in the series preclude time-series analysis – they showed that government misunderstood how much industry cares about official statistics. The series was suspended in 2012.
Image showing the cover of the "A DYNAMIC MAPPING OF THE UK'S CREATIVE INDUSTRIES" report by Hasan Bakhshi, Alan Freeman and Peter Higgs, January 2013 version. The cover has a green background with white text and a faint map-like graphic.
Text box outlining a "Three-stage procedure adopted by DCMS in January 2014":
1. Label some SOC codes as a 'creative'.
2. Label as 'creative industries' those SIC codes with high creative intensity (high percentage of workforce in creative roles).
3. 'Creative economy' = creative industries workers + creative workers in other industries.
For a number of years, researchers in Europe and in Australia had been using Household Census and Labour Force Survey data to measure employment in the creative industries and employment in creative occupations. A common feature of these studies was the top-down nature of their selection of SIC codes and Standard Occupational Classification (SOC) codes, the international standard by which occupations are classified by governments. This left these studies open to the criticism that they were not using a coherent group of SIC and SOC codes.
The contribution of the Dynamic Mapping – which we published with Alan Freeman at London Metropolitan University and Peter Higgs at the Queensland University of Technology in 2013 – was that an industry's creative intensity (the percentage of an industry's workforce in creative roles) could be used to identify creative from non-creative industries.
The approach is made up of three steps (Figure 2). In the first, we develop rules to label some SOC codes - that is, occupations - as 'creative'. In the second, we use Labour Force Survey data to label as 'creative industries' those SIC codes with unusually high creative intensity (adopting a threshold creative intensity above which all industries are labelled as creative). In the third step, we use these labels and the Labour Force Survey data to estimate employment in the 'creative industries' as well as the wider 'creative economy', which we define as employment in the creative industries plus creative workers employed in non-creative industries.
As a systematic methodology for classifying and measuring the size of the creative industries, the Dynamic Mapping has a number of features which has made it attractive to UK policymakers. First, it makes transparent the basis on which some occupations and industries are deemed creative and others not, which enables the statistics to be challenged and adapted. Second, it enables creative industries statistics to be constructed using official codes and data sources, which makes them strictly comparable over time and with other sectors. Third, it has enabled the UK to be the first country in the world to publish official creative economy statistics alongside its creative industries estimates. And fourth, it is 'dynamic', in that an industry's creative intensity can change over time meaning that, in principle, industries can become more, or less, 'creative'. For all these reasons, the DCMS adopted the method in January 2014 following a public consultation.
Diagram illustrating criteria to identify creative occupations in SOC codes.
Overall definition: "Roles bringing cognitive skills to bear to bring about differentiation to yield either novel, or significantly enhanced products whose final form is not fully specified in advance."
Criteria to identify creative occupations in SOC codes (presented as a list of questions and answers):
- Mechanisation resistant: Does the occupation have no clear mechanical substitutes?
- Novel process: Does the occupation commonly achieve a goal in novel ways?
- Non-repetitiveness or non-uniform function: Does the transformation the occupation effects vary each time it is done?
- Creative contribution to the value chain: Is the occupation creative irrespective of the context e.g. is the activity creative if done in a bank or a theatre?
- Interpretation, not just transformation: Does the occupation do more than 'shift' a service or artefact's form?
Source: Bakhshi, Freeman and Higgs (2013)
Delving into the methodology in just a little more detail, Figure 3 sets out one approach for identifying creative occupations (the first step in the three-step procedure). In our conceptualisation, creative occupations are those "roles that bring cognitive skills to bear to bring about differentiation to yield either novel, or significantly enhanced products whose final form is not fully specified in advance."
To operationalise this definition, we suggested a set of five intuitive criteria based on our reading of the various literatures on creativity at work, and subjectively scored all codes at the four-digit level in the UK Standard Occupational Classification against these criteria. We used the rule that an occupation had to score at least four out of five against these criteria to earn the label 'creative'. An inherently subjective exercise, we then spent a good deal of time testing the overall sensitivity of the results to this threshold and to the exclusion of more contested occupations. The results of this sensitivity testing are presented in great detail in the Nesta report.
Note that the DCMS's departmental focus, which does not include scientific creativity, has implications for how these criteria are implemented - in that occupations like natural and social scientists are not scored as creative when arguably they do share many common traits with creative roles. Consistent with this, when we adopt an alternative algorithmic approach to labelling creative occupations – which makes use of detailed skills content data for different occupations – we indeed identify a broader class of occupations as 'creative'.
Stacked area chart titled "Figure 4: An algorithmic approach to identifying creative occupations".
- Y-axis: Employment (M) ranging from 0 to 40.
- X-axis: Creative Probability ranging from 0 to 1.
The chart is divided into three probability zones:
* Low probability (0-0.3): 36% Employment.
* Medium probability (0.3-0.7): 40% Employment.
* High probability (0.7-1): 24% Employment.
The stacked areas represent different occupation categories (Management, Business, and Financial; Computer, Engineering, and Science; Education, Legal, Community Service, Arts, and Media; Healthcare Practitioners and Technical; Service; Sales and Related; Office and Administrative Support; Farming, Fishing, and Forestry; Construction and Extraction; Installation, Maintenance, and Repair; Production; Transportation and Material Moving), showing their distribution across the creative probability spectrum.
Source: Bakhshi, Frey and Osborne (2015)
Figure 4 is taken from a Nesta paper published in 2015 in collaboration with Carl Benedikt Frey and Mike Osborne from the Oxford Martin School at Oxford University. It uses UK Labour Force Survey data from 2013. In that study, we used expert judgement to label a sample of occupations as either 'creative' and 'not creative', and then used detailed skills descriptions of occupations from the US Department of Labor's O*NET database, to train a machine learning classifier which for all SOC codes in the UK workforce assigns a probability that a role is creative. Using this approach, we estimated that 24 per cent of the UK workforce was in creative roles (treating all occupations with a probability of higher than 0.7 as being 'creative') – which is around four times higher than what we find in the Dynamic Mapping and the official DCMS statistics. Reassuringly, the list included nearly all of the occupations labelled as creative in the Dynamic Mapping, but intuitively included a large number of other occupations – including, I'm pleased to say, economists and other social scientists - which many of us would like to think of as involving a high degree of creativity, even if the DCMS statistics cannot.
Bar chart titled "Figure 5: Where do the creatives work?".
- Y-axis: Number of creatively-occupied jobs, ranging from 0 to 600,000.
- X-axis: Creative intensity, per cent (bins: 0-5, 5-15, 15-25, 25-35, 35-45, 45-55, 55-65, 65-75, 75-85, 85-95).
- Bars are color-coded for "Non-creative industries" and "Creative industries".
Key data points highlighted in boxes:
* "In 2010, 1.4 million creative and other jobs in creative industries + 1.1 million creatives in the wider economy = 2.5 million jobs in the creative economy"
* "59% of creative talent works in a wider economy"
* "Creative industries distinguished by their intensive use of creative talent"
The chart shows a bimodal distribution, with high numbers of creative jobs in industries with very low creative intensity (0-5%) and very high creative intensity (55-65%, 85-95%).
Armed with our narrower list of creative occupations, in the second step of the Dynamic Mapping we inspected the distribution of creative employment across industries by their creative intensity. Figure 5 is taken from our 2013 paper and uses Labour Force Survey data from 2010. Perhaps the main contribution of the Dynamic Mapping was to note the bimodality of this distribution. On the one hand, the chart shows that large amounts of creative workers were employed in industries whose creative intensity was in single digits. So, the column on the left hand side of the chart shows that over 300,000 creative jobs were found in industries where less than 5 per cent of the overall workforce was made up of creative jobs. But, on the other it shows that large numbers of creative workers were also employed in industries with very high creative intensity. So, almost 400,000 creative jobs were found in industries with a creative intensity of between 55 and 65 per cent. Over 50,000 were found in industries where between 85 and 95 per cent of jobs are in creative roles.
We proposed a simple probabilistic procedure for identifying a threshold creative intensity – which turns out to be 30 per cent - and used this to partition the distribution into two. We labelled the industries shaded darker pink 'the creative industries' and the ones shaded lighter pink not creative. These non-creative industries are in fact very major employers of creative talent – as many people are employed in creative roles outside the creative industries as within – but what singles out the creative industries as a coherent group is that they each specialise in the employment of creative people.
A huge benefit of having creative economy statistics that are defined using the industrial and occupational classification standards is that it allows us to interrogate official data in a way that is consistent with other sectors and occupations, thus increasing the credibility of the statistics - and therefore the sector - in the eyes of policymakers. As internationally set standards, they raise the prospect of internationally comparable creative economy statistics too - something we have explored with Max Nathan and his co-authors using European Labour Force Survey data for EU countries and labour force survey data for the US and Canada.¹ Analysts in other countries – Australia, Denmark, Norway, Switzerland – are at various stages of applying the method too.
Reassuringly, when we look at the industry distributions of creative intensities in those countries for which we have data, we see the familiar bimodal shape - the creative workforce specialisation profile that is the defining feature of the Dynamic Mapping.
Importantly, the use of the standard industrial and occupational classification also enables us to test where the standards are lacking and point to ways in which they can be reformed. And we're delighted that we'll have an opportunity to explore further how the occupational and industrial standards can be improved through the work we'll be doing in the ONS's new Economic Statistics Centre of Excellence that Nesta has been selected to create with the National Institute of Economic and Social Research, Kings' London, Cambridge University, Strathclyde University and other partners.
Image showing two Nesta report covers related to the geography of creativity.
* The top cover is titled "The geography of creativity" by L. De Propris, C. Chapain, P. Cooke, S. MacNeill and J. Mateos-Garcia (Interim report: August 2009). It features a stylized diagram of connected dots.
* The bottom cover is titled "THE GEOGRAPHY OF THE UK'S CREATIVE AND HIGH-TECH ECONOMIES" by Hasan Bakhshi, John Davies, Freeman, Higgs (January 2015). It features a network diagram with red lines.
Text box outlining "Geographical hotspots of creative firms that collaborate and compete":
Previous research had shown they were a central feature of creative industries.
* The good: hotspots of innovation and growth.
* The not so good: regional inequality.
Question: How do we strengthen those that exist, and catalyse new ones?
One phenomenon that has held the interests of industrial policymakers since at least 1990 when Michael Porter popularised it, is the idea of industrial clusters. In the creative economy these are defined as geographical hotspots of creative businesses that collaborate and compete (Figure 6). Previous research, including Nesta's, had shown that these are a central feature of creative industries and the wider creative economy. The positive finding was that these clusters were associated with high rates of innovation and economic growth. But the downside was that they were unevenly spread across the country. In 2015's The Geography of the UK's Creative and High-Tech Economies we showed that London and the South East of England accounted for 43 per cent of all employment in the creative economy. Because this estimate was constructed on the basis of the new DCMS classifications, making use of standard codes, we could show that it compared with 31 per cent in the high-tech economy and 28 per cent in the UK workforce as a whole.
Two big questions were, therefore, how do we strengthen creative clusters that exist, and catalyse new ones that don't?
Image showing the cover of the Nesta report "A MANIFESTO FOR THE CREATIVE ECONOMY" by Hasan Bakhshi, Ian Hargreaves and Juan Mateos-Garcia (April 2013). The cover is dark blue with white text and a stylized abstract graphic.
Text box outlining the "Seven-point programme to build clusters":
1. Be data-driven.
2. Be pragmatic.
3. Listen.
4. Invest in knowledge, and in people.
5. Leverage anchor institutions.
6. Raise visibility and strengthen networks.
7. Think systemically.
In A Manifesto for the Creative Economy, published in 2013 with Professor Ian Hargreaves, we proposed a seven-point plan for policymakers and local development agencies (Figure 7).
The first point was: be data-driven. Policymakers should use data to identify areas of existing local strength, including measuring the number, size and trajectory of local firms in different creative sub-sectors, and the types of graduates and research being produced by local universities. We noted the value of benchmarking against other places. Policymakers needed also to be mindful of the limitations of official data sources where, for example, micro-businesses and freelancers were often unrepresented, or where the activities of emerging sectors were mis-classified. In these cases we urged greater use of alternative data, such as that which can be scraped from company websites or social networks.
Our second point was that policymakers should be pragmatic: they were advised to avoid wishful attempts to build clusters from scratch, as successful examples of the latter were few and far between. All the evidence suggested that a locality's industrial opportunities are heavily constrained by its current strengths and weaknesses. A more productive approach was to build on areas of existing strength.
The third point in our plan was that policymakers should listen: they should adopt a similarly data-driven approach to identifying barriers to cluster development and potential remedies. Learning from the experience of stakeholders was important, but this required honest and self-critical evaluations of policies and detailed consultation with local businesses. When doing this, it was important to minimise the risk of capture by local vested interests by listening to all the voices in the cluster, not just those that were within easiest reach.
We argued that policymakers should invest in people as well as buildings: policymakers had historically conceived of interventions to support clusters in terms of new buildings – such as incubators, cultural quarters and iconic arts centres - rather than investments in creative and entrepreneurial skills. Yet, it was creative talent that was the defining asset of the creative economy. Policymakers, we argued, should weigh the opportunity costs of investments in 'bricks and mortar' against the benefits of other interventions, for example, work placements and internships for creative graduates. The outcomes of these investments might be less obviously visible than in the case of capital projects, but they might be more beneficial in the long run.
Fifthly, we stressed the importance of leveraging anchor institutions, such as universities, in developing creative clusters. Universities played an obvious role in the areas of talent supply and research, but the more entrepreneurial ones were developing alternative ways of supporting the creative economy, such as through convening networks and promoting knowledge exchange.
The sixth point in the plan was that policymakers should raise visibility and strengthen networks. A finding of our much earlier work on creative clusters² was that an unconnected, 'un-self-aware' mass of creative businesses would not fully benefit from knowledge spillovers or sharing of local resources. We suggested that policymakers could help remedy this situation by promoting local opportunities to creative talent and by supporting local business networks (and a priority was to develop fit-for-purpose evaluation methodologies that can guide policymakers in making these efforts).
And last, but not least, we urged policymakers to think systemically. We characterised creative clusters as having their own distinctive innovation systems - comprising local labour markets, research bases, financial systems, (physical, digital and cultural) infrastructures, and mechanisms for collaboration and competition. Clusters were also embedded in an international creative economy. This meant that discrete interventions would rarely be enough to support sustainable growth in a cluster – it was important to pay attention to the whole system.
Fortunately, since writing A Manifesto for the Creative Economy, as more and more data sources have become available to researchers and as economists we have become more adept at using computational techniques from data science, we've been able to develop our thinking further. In Tech Nation 2016, we have identified and mapped the UK's digital tech clusters in partnership with Tech City UK. And in The Geography of Creativity in the UK, with Creative England, we have revisited the case of creative clusters.
We have sourced data from wherever we have been able to find it - from the Office for National Statistics, open data sources and by scraping data from online sources (Figure 8). We have also employed analytical techniques that have not traditionally been used to characterise creative clusters, including machine learning and social network analysis. And we have tried to take seriously the economic complexity of creative clusters, while at the same time attempting to make that complexity analytically tractable through the use of interactive maps and other data visualisations.
Image showing the cover of the Nesta report "The Geography of Creativity in the UK" by Juan Mateos-Garcia and Hasan Bakhshi (July 2016). The cover is dark blue with white text and a stylized map-like graphic.
Text box outlining points related to "Harnessing variety of data":
* Harnessing variety of data:
* Official data to measure economic performance.
* Open data to measure talent and knowledge supply.
* Web data to map networks.
* Adopting new statistical methods to characterise industrial clusters.
* Empowering local actors with interactive maps and data.
The Geography of Creativity confirms that the creative industries account for a growing share of economic activity in local economies across the UK regions and nations. It uses data from the ONS's Business Structure Database to show that the creative industries have gained in importance over the period 2007-2014 in most Travel to Work Areas (TTWAs) – which you can think of as roughly corresponding to metropolitan areas. The business numbers are particularly striking, with more than nine in ten of UK TTWAs having grown their creative business numbers as the share of overall businesses (Figure 9). It turns out that creative services sub-sectors like Design, Software and digital and Advertising have grown particularly rapidly.
Two horizontal bar charts showing changes in creative share of economic activity (2007-2014) for different regions/nations.
Accompanying visuals:
* A set of small bar charts displaying "Not normalised" and "Normalised" percentages of areas that experienced growth in various creative sub-sectors (Design, Software and digital, Advertising, Film, radio and TV, Architecture, Publishing, Music and performing arts). Metrics include Number of businesses, Turnover, Employment, Turnover per worker, Average firm size.
* Two larger bar charts showing "Employment Percentage" and "Business number Percentage" of UK activity in 2014 for different regions, highlighting concentrations in London and South East.
Text annotations:
* "Declining firm sizes creative fragmentation"
* "Increasing concentration London/SE: a creative divide?"
But mindful of challenges
But the other implication of the high rate of business entrepreneurship is that almost all sub-sectors have experienced a reduction in average firm size: in 2007, creative businesses in the UK employed on average just under four workers; by 2014, that had declined by 15 per cent to 3.3. The report confirms again the high concentration of creative activity in London and the South East of England, and shows that if anything this concentration is getting more pronounced over time.
Map of the UK and Ireland showing 47 identified creative clusters, color-coded by type.
-
Legend:
- High concentration & growth
- High concentration
- High growth
-
List of 47 clusters:
- Edinburgh
- Glasgow
- Newcastle
- Belfast
- Middlesbrough and Stockton
- Harrogate
- Leeds
- Liverpool
- Manchester
- Warrington and Wigan
- Sheffield
- Chester
- Crewe
- Norwich
- Peterborough
- Northampton
- Leamington Spa
- Cambridge
- Milton Keynes
- Colchester
- Cheltenham
- Luton
- Chelmsford
- Oxford
- High Wycombe and Aylesbury
- London
- Southend
- Cardiff
- Bristol
- Slough and Heathrow
- Reading
- Newbury
- Bath
- Medway
- Canterbury
- Trowbridge
- Basingstoke
- Guildford and Aldershot
- Tunbridge Wells
- Southampton
- Hastings
- Eastbourne
- Chichester and Bognor Regis
- Brighton
- Bournemouth
- Exeter
- Penzance
Source: ONS, Business Structure Database; Nesta analysis.
Text box: "Several of the clusters we have identified fall outside of the 'creative cities' model. We also find big differences in sectoral breakdown and industrial structure."
A key research finding is that creative clusters can take very different forms. Our method for identifying clusters is to group creative sub-sectors together based on their colocation patterns and then to look for geographic hotspots of group activity. We measure activity by concentration levels (that is, the relative importance of the sector in the local economy) and also in terms of how rapidly creative activity has grown over time (in this way capturing up and coming clusters).
Figure 10 shows the 47 clusters we identify using this method. It highlights that although creative clusters have a stronger presence in London and the South East of England (which together account for around a third of the clusters we identify), there are also hotspots of creative activity throughout the UK. The map also suggests that there are several creative agglomerations encompassing more than one TTWA: we see this around Manchester and Leeds, for example, but also Bath, Bristol and Cardiff. Note also the appearance of locations like Slough and Heathrow, High Wycombe and Aylesbury, Peterborough, and Guildford and Aldershot – far from 'creative cities' as usually defined. These clusters – specialising in a small number of sub-sectors with large high-technology companies – may be less 'hip' than creative cities like Liverpool, Manchester and Cardiff with their more sub-sectorally diversified creative economies, but they make outsized contributions to the creative economy. The message for policymakers is clear: one size does not fit all when it comes to creative clusters.
Multiple radial charts (coxcomb diagrams) showing levels of talent provision, research, and knowledge exchange for 33 creative clusters.
Each diagram represents a cluster (e.g., London, Glasgow, Manchester, Edinburgh, etc.) and uses segments to indicate scores (from 1 to 10) for various indicators:
* Qualifiers - Computer Science
* Research - Computer Science
* Knowledge Exchange - SME engagement
* Knowledge Exchange - SME training
* Qualifiers - Arts and Design
* Research - Arts and Design
* Knowledge Exchange - Spin-out turnover
* Knowledge Exchange - Event attendees
The score ranges from 0.0 to 10.0 on the Y-axis (radial extent).
The report also documents the significant levels of university activity – both in terms of relevant education and research – that takes place in the UK's creative clusters. The coxcomb diagram in Figure 11 depicts for 33 of the creative clusters the levels of talent provision (using data on the number of graduates in Arts and Design and Computer Science from the Higher Education Statistics Agency), high quality research (measured by the number of full-time equivalent researchers doing world-class research in these disciplines as captured in HEFCE's Research Excellence Framework data) and knowledge exchange (based on a number of indicators we extract from the Higher Education Statistics Agency's Higher Education-Business Community Interaction Survey). The length of the segments represents the level of local activity in each of these indicators relative to other clusters and ranges between one and ten (with one meaning that the area is in the bottom 10 per cent of all clusters and ten meaning that it is in the top 10 per cent). As we might expect, London scores highly on all the variables, but so do other clusters seemingly benefit from strong talent and knowledge ecosystems, including Cardiff.
Some of the findings appear to mirror differences in cluster specialisms - Brighton's excellence in Arts and Design research and its high levels of event attendees (one measure of knowledge exchange activity) might be linked to the city's cultural scene, for example, while Bristol - the UK's HQ for Hewlett Packard and home to a vibrant tech cluster - has strengths around Computer Science education and research. Cardiff, with its strong film, television and radio sector and rapidly growing software development sector, has strengths in Arts and Design and Computer Science education and performs broadly well on all knowledge exchange activities.
Stacked area chart showing "Active meetup groups (cumulative)" over "Year created".
- Y-axis: Active meetup groups (cumulative), from 0 to 3000.
- X-axis: Year created, from 0% to 80% (implying growth over time).
The chart segments are colored for "Meetup type":
* Other (bottom, yellow-orange)
* Creative (top, dark orange)
The chart shows significant growth in both meetup types, with creative meetups forming a substantial and growing portion.
Text box annotation:
"Networking seems to be driven by digitisation, growing importance of freelancers. It is stronger in 'creative cities'."
Using data from online events platform Meetup.com, we also try and quantify the importance of networking activity in the creative industries. Specifically, we obtain data about active UK meetup groups focused on tech and business networking, and use text mining techniques to identify those that specialise in creative topics, such as Mobile and Games, Web Design and Digital Marketing. It turns out that there are 1,202 active meetup groups focusing on these creative topics with participation of around 170,000 unique individuals (Figure 12).
On this measure there has been an explosion of creative meetup activity paralleling the growth of the creative industries. Topics like 'freelance work', 'user experience' and 'data analytics' have grown especially quickly. Meetup data also permits us to look at how networking activity varies across creative clusters: there is a striking contrast between creative cities like Cambridge, Manchester and Edinburgh on the one hand, and creative conurbations like Reading, High Wycombe and Guildford on the other, with the latter having much lower levels of networking activity relative to the size of their creative workforce, a narrower range of topics discussed and low levels of inter-sector networking. No doubt this partly reflects the more specialised and larger firm nature of creative activity in these clusters; nonetheless, these findings raise the question of whether more developed levels of networking will be needed to help sustain the long-term success of these clusters.
We look at the topics that different creative clusters specialise in, based on the number of meetup groups in that topic. Creative cities tend on the whole to have more diversified creative meetup scenes, with activity in a wider range of topics. Cardiff creative meetup activity seems particularly centred on Data Analytics.
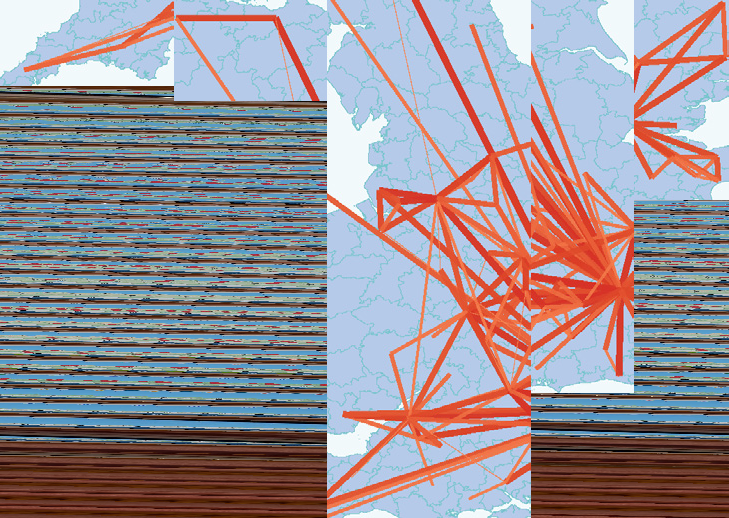
Two maps of the UK and Ireland showing creative community connections (meetup co-membership patterns) between pairs of Travel to Work Areas (TTWAs).
- Left map: "Not normalised" view, showing raw intensity of connections.
- Right map: "Normalised" view, showing connections normalised by the sizes of participating communities.
Both maps feature orange lines connecting various regions, indicating a network of interactions.
- Legend ("Number of connections (Decile)"):
Source: Meetup.com; Nesta analysis.
The meetup data are also interesting in revealing the 'hidden connections' between the UK's creative clusters. Figure 13 investigates the meetup co-membership patterns of individuals based in different places. The left hand panel shows the most intense creative community connections between pairs of TTWAs, while the right hand one normalises this measure by the sizes of the participating communities.
The figures point to examples of strong connections between some clusters, including Bristol, Bath and Cardiff in the West; Edinburgh and Glasgow in Scotland, and cities like Manchester, Leeds, Sheffield and Liverpool in the North of England. The data further show that one in ten members of creative meetups in the UK are actually based outside the UK; 41 per cent of these are based in EU countries. For reasons which should be obvious, policymakers must pay attention to the importance of these connections in coming years.
It should be apparent that we have come a long way in characterising creative clusters from the simple business population heatmaps that we and others relied on to identify clusters just a few years ago. The expanding universe of potential data sets permits more granular and more timely characterisation of the systems within which creative businesses operate and, notwithstanding the challenges in using data that was not created for the purposes of analysis, our experience is that there is much to be gained in mining them.
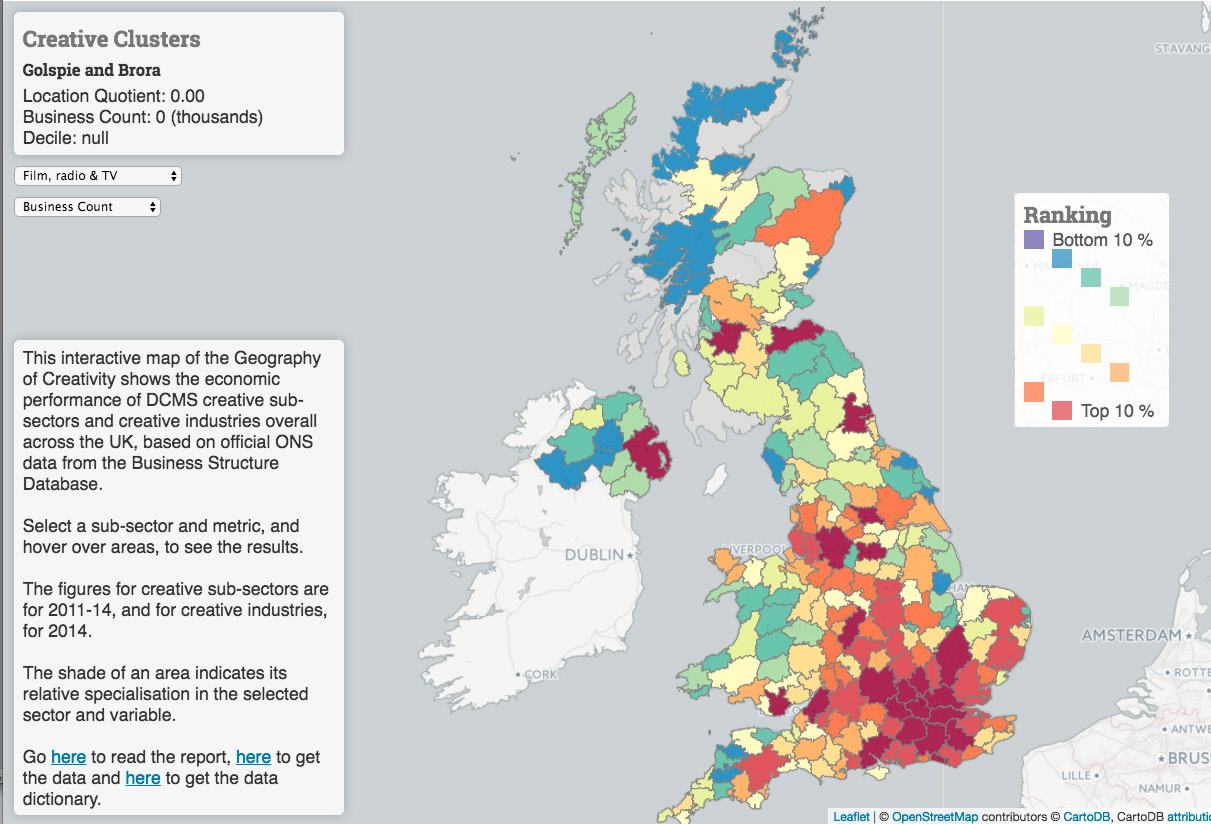
Interactive map of the UK and Ireland showing "Creative Clusters", color-coded by economic performance in creative industries.
- Legend:
- Ranking: Bottom 10%, Top 10% (indicated by color shading).
- Info panel example: "Golspie and Brora", "Location Quotient: 0.00", "Business Count: 0 (thousands)", "Decile: null".
- Filters: "Film, radio & TV", "Business Count".
Descriptive text overlay:
"This interactive map of the Geography of Creativity shows the economic performance of DCMS creative sub-sectors and creative industries overall across the UK, based on official ONS data from the Business Structure Database. Select a sub-sector and metric, and hover over areas, to see the results. The figures for creative sub-sectors are for 2011-14, and for creative industries, for 2014. The shade of an area indicates its relative specialisation in the selected sector and variable. Go here to read the report, here to get the data and here to get the data dictionary."
Source: Leaflet | © OpenStreetMap contributors CartoDB, CartoDB attribut
A consequence of the much richer set of insights that can be gleaned from the data is that there is a wider set of constituencies and potential users who can derive value from it. And for that reason, where possible, we have made publicly available the data sets we have used. We've found that data visualisation tools such as interactive maps, e.g. Figure 14, are a powerful and popular way of allowing users to understand the data, and maximise the insights they get from research.
And in projects like our gamesmap.uk with games trade body, Ukie (Figure 15), which is targeting industry users, and our ongoing Arloesiadur project with innovation policymakers in the Welsh government, we are exploring this value proposition further.
So trying to bring all of this together, the suggestion is that the story of measurement of the creative economy - initiated by the DCMS 20 years ago - has been one of a search for legitimation. In the UK at least, some progress has been made on that score, and it must surely be the case that the success of campaigns such as those to extend tax reliefs to various sub-sectors of the creative industries in recent years or to overhaul the teaching of ICT in English schools, cannot wholly be separated from the turn to stronger metrics.
However, the opportunity now is to give data a more active role in local creative economy development – to move beyond legitimation – and I hope some of the research I have outlined points to ways this might be done. I end by noting areas where our work shows there are immediate opportunities for policymakers, agencies and other bodies like Local Enterprise Partnerships and universities with a brief to develop their creative economies. Like local labour market strategy, where we've shown that data scraped from online job ads can be used to paint a detailed, real-time picture of employer skills needs which can be compared with the education profile of local universities that I've presented today. Or the relationship between cultural activity and the creative economy, where we can use the location of cultural venues based on listings data to see whether there is any correlation between cultural vibrancy and the performance of creative industries.⁵ Or finally – the subject of one of our workstreams in the Arloesiadur project – what the industrial make up of places means for the nature of related industries that may develop there in the future.⁶
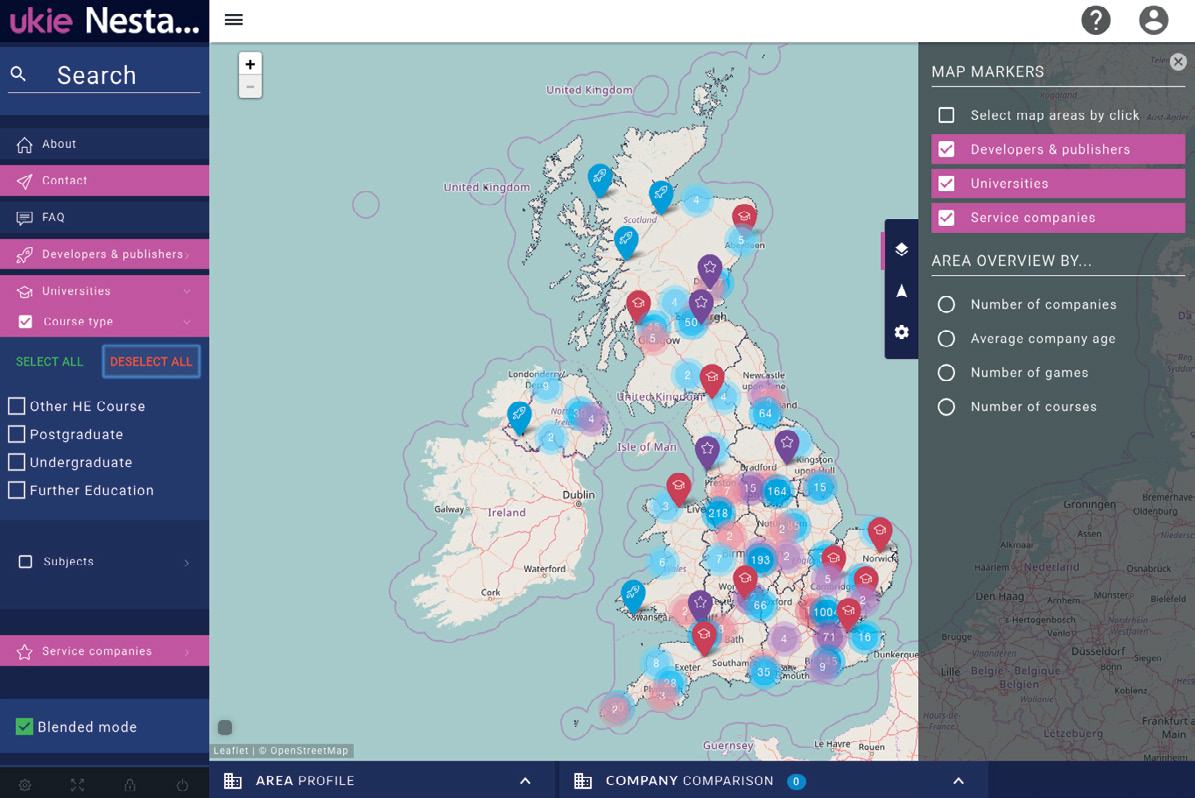
Two screenshots of the "gamesmap.uk" interactive map from September 2014 and September 2016.
The map displays clusters of game developers, publishers, universities, and service companies across the UK and Ireland. The interface includes search functionality, an "About" section, "FAQ", and filters for different types of entities (Developers & publishers, Universities, Service companies). It also has options for "AREA OVERVIEW BY..." (Number of companies, Average company age, Number of games, Number of courses). The map shows various locations marked with colored pins.
Source: Leaflet | © OpenStreetMap
Endnotes
- Nathan, M., Pratt, A. and Rincon-Aznar, A. (2016) 'Creative Economy Employment in the European Union and the United Kingdom: A Comparative Analysis.' London: Nesta; Nathan, M., Kemeny, T., Pratt, A., and Spencer, G. (2016) 'Creative Economy Employment in the United States, Canada and the United Kingdom: A Comparative Analysis.' London: Nesta.
- Chapain, C., Cooke, P., De Propris, L., MacNeill, S. and Mateos-Garcia, J. (2010) 'Creative Clusters and Innovation.' London: NESTA.
- http://www.nesta.org.uk/blog/arloesiadur-innovation-analytics-experiment
- http://www.nesta.org.uk/blog/top-30-skills-chart
- http://www.nesta.org.uk/publications/capital-culture
- http://www.nesta.org.uk/blog/complex-places-complex-times-analysis-complexity-uk-local-economies-and-their-future-evolution
Hasan Bakhshi is Senior Director, Creative Economy and Data Analytics at Nesta.
58 Victoria Embankment
London EC4Y ODS
+44 (0)20 7438 2500
[email protected]
@nesta_uk
www.facebook.com/nesta.uk
www.nesta.org.uk
Nesta is a registered charity in England and Wales with company number 7706036 and charity number 1144091. Registered as a charity in Scotland number SCO42833. Registered office: 58 Victoria Embankment, London, EC4Y ODS.
Creative Commons Attribution-NonCommercial-ShareAlike (CC BY-NC-SA) License.





